


The NILT is one of the most influential surveys of political, constitutional and social attitudes in the north. It has been tracking these attitudes every year since 1998, except for 2011 when the survey was not conducted because of insufficient funding[1]
That the NILT may provide biased estimates of people’s long-term constitutional preferences is a major concern. Everyone who has used the survey needs to reconsider and perhaps alter any conclusions about relative popular support for union and unity. Everyone who plans to use the survey needs to approach its constitutional data with skepticism.
One Puzzle
My aim is to examine the constitutional preferences of people in the north since the Good Friday Agreement of 1998. I draw all my data from the statistical tables published on the NILT website. [2]
Each year, the NILT asks survey respondents if they think the long-term policy for the north should be to remain part of the UK or reunify with the rest of Ireland. Later I examine exactly how this question is asked. For now, let’s accept that this question is the basic measure of long-term constitutional preference. In the analysis below, I trace over time both support for the union and support for unity.
NILT designers have constructed a religion variable made up of the three categories of Catholics, Protestants and people with no religion. They omitted members of other religious groups from this categoric variable because the numbers were too small for rigorous analysis. Later, they removed these other groups from the dataset to protect the anonymity of survey respondents.
Figure 1 plots, for the years 1998 to 2019, the percentage of each religious group that supports maintaining the union. The Figure also tracks support for the union among all respondents to the survey. The four groups are colour-coded, with the black line representing all respondents; the orange, Protestants; the green, Catholics; and the red, those with no religion. The Figure shows that, at the time of the GFA in 1998, support for the union stood at 85 percent for Protestants, just less than 60 percent for all respondents and the no religion group, and 19 percent for Catholics. Other points along the various lines are interpreted the same way.
A few technical words about my analysis are necessary. First, the percentages in Figure 1, and in all subsequent figures and tables, include any “don’t know” or “refused” categories of respondents. I don’t display the results for these groups, except in Table 3. Second, the percentages for the all-respondent category are not independent of the percentages for the three religious groups. They are an amalgam, or more precisely a weighted average, of the three. That is why the black line for all respondents appears near the middle of the other lines in Figure 1. I continue to track the all-respondent group as it shows a concise summary of overall trends.
Many features of Figure 1 deserve comment. But I wish for now to focus on one persistent trend. Three groups—all respondents, Catholics and those with no religion—show a sharp increase in support for the union in 2007. For all respondents, support for the union climbs from 54 percent in 2006 to 66 percent in 2007. For Catholics, support grows from 22 percent to 39 percent. And, for the no religion group, it rises from 46 percent to 71 percent. This step change in support for the union is the largest and most consistent increase in the entire Figure. The year 2007 appears as a watershed for these sets of respondents: not only is their support for the union higher in 2007, it remains on a higher plane after 2007 than it was before. Specialists in research design refer to this pattern as an “interrupted time series.” [3] Some significant “interruption” appears to have happened between 2006 and 2007, with effects that persist over time.
 |
Let me depart briefly from my focus on the 2007 interruption to mention two other points about Figure 1. It shows a drop in support for the union in 2012, which is especially sharp among Catholics. It’s difficult to interpret what this drop means because we have no data for 2011, although the flags crisis broke out at the end of 2012 and might have had some effect on constitutional preferences. The Figure also indicates declining support for the union in the last years of the series, except for Protestants, whose support increases in 2019. Some analysts have speculated that this pattern of support is related to the Brexit dispute. [4]
Figure 2 shows group levels of support for Irish unity over the same period. It is in important ways a reverse image of Figure 1, with the Catholic line at the top indicating significant support for Irish unity and the Protestant line at the bottom indicating very little support for reunification. Complementing the pattern we found earlier, Figure 2 reveals a sharp decrease in support for unity in 2007. For Catholics and those with no religion, support for unity drops by 9 percentage points from 2006 to 2007. For all respondents, it falls by 7 points. There is also an observable reduction in support among Protestants but the decline is less steep than it is for the other groups. Another watershed pattern appears in Figure 2. Looking across the entire period, support for unity is on a lower level after 2007 than it was before. Again, whatever happened in 2007 had an enduring influence.
 |
Tables 1 and 2 summarize the principal trends we see in the two figures. Table 1 takes 2007 as the watershed year or dividing line. It displays the average levels of group support for the union across two periods, from 1998 to 2006 and from 2007 to 2019. The Table shows that, on average, 56 percent of all respondents express support for the union in the earlier period. Their average level of support for the union in the later period increases to 65.9 percent. Average support for the union among all respondents is, then, 9.9 points higher in 2007-2019 than it was in 1998-2006. All other groups also show increased levels of support for the union in the later period. The growth of support is most striking for Catholics. On average, more than twice as many Catholics support the union in 2007-2019 (44.1%) as in 1998-2006 (20.4%), yielding an increase of 23.7 points.
Table 2 gives comparable results for support for unity. Across all four groups, we see a decline in average support for Irish unity over the two periods. Again, the effect is strongest among Catholic respondents: their support for unity in 2007-2019 is on average 12.4 percentage points lower than it was in 1998-2006.
Table 1: Average Support for Union By
Religion, 1998-2006 and 2007-2019
|
Group |
Average
Percent* Supporting Union: |
Percent Difference** |
|
|
1. 1998-2006 |
2. 2007-2019 |
||
|
All Respondents |
56.0 |
65.9 |
+9.9 |
|
Catholics |
20.4 |
44.1 |
+23.7 |
|
Protestants |
83.8 |
87.5 |
+3.7 |
|
Those with No Religion |
51.3 |
63.8 |
+12.5 |
*Average percent saying that the long-term policy for NI should be for it to remain part of the UK. The entries in the table are means.
**Percent Difference = percent in period 2 – percent in period 1.
Table 2: Average Support for Unity By
Religion, 1998-2006 and 2007-2019
|
Group |
Average
Percent* Supporting Unity: |
Percent Difference** |
|
|
1. 1998-2006 |
2. 2007-2019 |
||
|
All Respondents |
23.2 |
18.3 |
-4.9 |
|
Catholics |
49.6 |
37.2 |
-12.4 |
|
Protestants |
4.3 |
3.2 |
-1.1 |
|
Those with No Religion |
19.1 |
14.0 |
-5.1 |
*Average percent saying that the long-term policy for NI should be for it to reunify with the rest of Ireland. The entries in the table are means.
**Percent difference = percent in period 2 – percent in period 1.
What might account for the puzzling change in long-term constitutional preference that we see from 2007 in the figures and tables? In the next section, I examine what the interruption might be, focusing on the main effect of growth in support for the union.
Two Explanations
Two explanations of the conspicuous and persistent increase in support for the union come immediately to mind. One sees the increase as real substantive change in people’s attitudes towards the union caused by the experience of devolution. The other views it as artificially-induced change, the result of an alteration in the way the NILT measures constitutional preference. [5]
1. The Devolution Effect
In 2006-2007, northern residents had some reason to believe that the seemingly permanent crisis in devolution was being resolved. The St Andrews Agreement was reached in October 2006, and power was restored to Stormont’s suspended institutions in May 2007. If people perceive that devolution is working stably and effectively, they might be more accepting of current constitutional arrangements and therefore more likely to express support for the union. I’ll refer to this proposed explanation as the devolution effect. In short, it suggests that the more favourable the assessment of devolution, the greater the support for the union. The devolution effect might account for the change we see starting in 2007.
Before 2007, devolution was not working. The GFA was beset by serious implementation problems from the moment it was agreed in April 1998. Generally, these problems concerned the decommissioning of IRA arms, the stability of the Agreement’s institutions, and policing and justice matters. Britain suspended devolved government in the north four times between February 2000 and October 2002. The fourth suspension lasted for four-and-a-half years. [6] Devolution crises were so frequent that in the nine years from the signing of the Agreement in April 1998 to the restoration of Stormont’s power in May 2007, devolved institutions operated only 30 percent of the time.
Hopeful political developments in 2006-2007 may have seemed especially significant because of the severity and length of Stormont’s problems. They might also have seemed significant because they were so unusual. News reports of the 2007 power-sharing deal between Sinn Féin and the DUP recognized that the two traditional enemies faced many challenges in working together effectively. But the reports also heralded a potential new beginning for the north (Graham, 2007a & 2007b). Let’s examine the devolution explanation to see if this new hope for power-sharing government has an impact on the level of support for the union.
As a first test of the devolution effect, we can look back at Figure 1’s tracking of support for the union over time. This test is inconclusive. On the one hand, any renewed faith in devolved government, because of the St Andrews Agreement and the restoration of power-sharing, might account for the bump in support for the union between 2006 and 2007. [7] On the other hand, an effective devolution settlement cannot account for the continuing high levels of support for the union after 2007.
As we know, neither the St Andrews Agreement in 2006 nor the reinstatement of devolved institutions in 2007 resolved Stormont’s ongoing difficulty. If there were any promise in these developments, it remained spectacularly unfulfilled. We saw as many devolution crises after 2006-2007 as before. Those crises included: an Executive that did not meet for five months in 2008 because of a deadlock over the devolution of policing and justice matters, which was resolved only in February 2010 with the Agreement at Hillsborough Castle; the failure of the 2013 Haass talks on flags and emblems, parades and protests, and the legacy of the past; the continuing inability of the 2014 Stormont House Agreement and 2015 Fresh Start Agreement to resolve the issue of how to address the past and other matters; unionists’ on-and-off withdrawal from the Executive in 2015 in the wake of the killings of Jock Davison and Kevin McGuigan; and Martin McGuinness’s resignation as deputy first minister in January 2017, which led to the collapse of the Assembly and Executive. The crises continued beyond our last data point in 2019, as evidenced by ongoing dissatisfaction with the New Decade, New Approach deal that restored devolved government in January 2020, three years after McGuinness’s resignation; chronic disputes about Brexit and the Irish protocol that hinder Stormont’s effectiveness; loyalist street violence whipped up by scaremongering unionist leaders; and the destabilizing impact of the fragmentation of political unionism.
Serial political disturbances between 2007 and 2019 might help to explain some of the yearly fluctuations in support for the union that are evident in Figure 1. But they cannot explain the overall watershed pattern in the data. Despite the many post-2007 crises in devolution, support for the union is at a higher level after 2007 than it was before. This pattern is inconsistent with any explanation proposing that the enhanced effectiveness of the devolution settlement after 2007 leads to increased support for the constitutional status quo. There is no enhanced effectiveness and yet support for the union stays relatively high. [8]
A second and more explicit test of the devolution effect involves examining some NILT questions that directly measure people’s attitudes towards devolution. The NILT has a large repertoire of survey questions. Some questions—long-term constitutional preference, for example—are asked each year the survey is conducted, but others are not. I looked for questions measuring people’s assessments of devolved government that were asked in enough years that I could usefully track their results against the results for constitutional preference. And I needed those questions to be asked both before and after the watershed year of 2007. I found three such questions.
The first question is a measure of trust in the Assembly. It asks respondents: “how much do you trust the Northern Ireland Assembly to work in Northern Ireland’s best interests? Just about always, most of the time, only some of the time, almost never.” This question is included in the surveys in 2001, 2003, 2007 and 2015. Figure 3 plots, for all respondents, the results for trust in the Assembly against the results for support for the union. I use the data for all respondents to get an overall look at general trends. The blue line in Figure 3 shows the percentage of all respondents who say they trust the Assembly “just about always” or “most of the time.” The black line, as in the Figure 1, displays the percentage of all respondents who express support for the union as their long-term constitutional preference.
Given that the question on trust in the Assembly is asked only four times between 2001 and 2015, interpreting Figure 3 is hindered by large gaps in the data points. But let’s see what the Figure suggests.
If devolution has the proposed impact on constitutional preference, we expect that high trust in the Assembly will be associated with high support for the union. Figure 3 both confirms and denies the devolution-effect hypothesis. From 2003 to 2007, increasing trust in the Assembly is matched by rising support for the union, which is a result consistent with a devolution explanation. But the Figure also shows, from 2007 to 2015, a pattern of rapidly declining trust with growing support for the union. This result is inconsistent with a devolution effect. Overall, Figure 3 suggests that any devolution effect was short-lived, diminishing rapidly after 2007. Finding more data points between 2007 and 2015 might help to confirm the existence of the trend we see in limited form in Figure 3.
 |
This Figure substantiates the conclusion reached in examining Figure 3: there is no consistent devolution effect on support for the union. Figure 4 shows that, from 2001 to 2007, support for the union rises with favourable assessments of the Assembly, as we would expect if our devolution explanation is valid. But in 2008, support for the union continues to rise while favourable views of the Assembly plummet, which is not what we would expect. Again, against our expectation, support for the union rises then levels off from 2012 to 2014, at the same time as favourable views of the Assembly continue to fall.
The most arresting feature of Figure 4 is that, after 2007, a wide gap opens up between the black and blue lines. This gap emerges because a high level of support for the union moves along with a low level of confidence in the Assembly. The size of this gap is an indication of the implausibility of the devolution explanation. Whatever is keeping support for the union relatively high after 2007, it does not appear to be positive views about the operation of the Assembly.

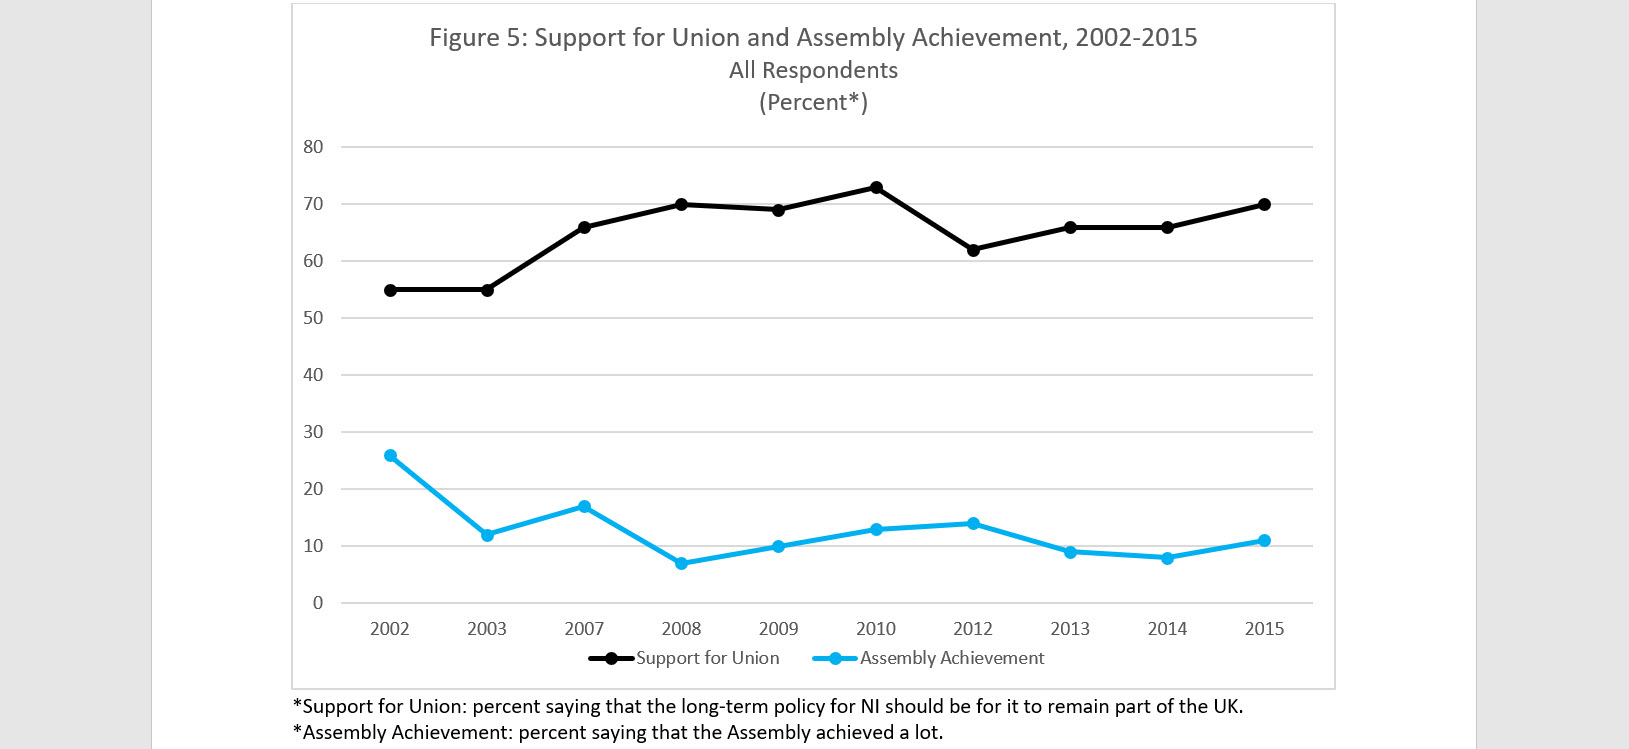
Figure 5 confirms the trends indicated in Figures 3 and 4. This latest Figure plots the results for the third question measuring evaluations of devolution. The question asks: “Overall, do you think that the Northern Ireland Assembly achieved a lot, a little, or, nothing at all?” The blue line displays the percentage of all respondents who say that the Assembly achieved a lot. Once again, in Figure 5, we see that support for the union and favourable views of the Assembly rise together in 2007, suggesting that devolution has a positive effect on support for current constitutional arrangements. Thereafter, the pattern is often inconsistent with a devolution effect: in 2008, support for the union rises as positive assessments of Assembly achievements fall; this pattern is repeated from 2012 to 2014.
Like in Figure 4, the most visually compelling aspect of Figure 5 is the large distance between the two lines. Elevated support for the union, in the range of 60 to 70 percent after 2007, continues amid low opinions of the Assembly’s achievements, with only some 10 percent of all respondents saying that the Assembly achieved a lot. The devolution-effect hypothesis appears unconvincing.
Taken together, Figures 3, 4 and 5 suggest a short-term devolution effect: in 2007, support for the union increases as assessments of devolution become more favourable. We might infer that the restoration of devolved government in May 2007 after an absence of some four-and-a-half years led to wider acceptance of the constitutional status quo. There is, however, no uniform devolution effect after 2007. Support for the union does not move in tandem with assessments of the effectiveness of devolution. Overall, the former remains high, the latter stays low. [9] If devolution offers a flawed account of the elevated level of popular support for the union in the post-2007 period, what other explanation might we consider?
2. The Question-Wording Effect
Something else happened between 2006 and 2007, other than the St Andrews Agreement and the consequent revival of power-sharing government. There was another, completely different, interruption. In 2007, the NILT significantly altered the question used to measure long-term constitutional preference. This change might have influenced how people answered the question. That is, we need to entertain the possibility that the increased support for the union (and the decreased support for unity) that we see in 2007 and beyond is a result of the new way in which the question was asked. [10] Let’s call this possibility the question-wording effect. It suggests that we may not be seeing real change in people’s constitutional preferences. Rather, we may be seeing artificial change produced by a modification of the measuring instrument.
The question-wording effect needs to be actively considered as a plausible explanation of the change in long-term constitutional preference that begins in 2007. It should not be relegated to a technical note buried at the end of a paper or the foot of a figure. It needs fully to be taken into account when interpreting trends in constitutional preference over time. [11]
From 1998 to 2006, the NILT measures long-term constitutional preference with this question:
Do you think the long-term policy for Northern Ireland should be for it to remain part of the United Kingdom, or to reunify with the rest of Ireland?
From 2007 onward, it uses new question wording:
Do you think the long-term policy for Northern Ireland should be for it to remain part of the United Kingdom, with direct rule; to remain part of the United Kingdom, with devolved government; or, to reunify with the rest of Ireland?
The new response options in the 2007 wording represent important change. The old question is balanced in that it offers survey respondents one opportunity to express support for the union and one opportunity to express support for unity. The new question introduces a glaring imbalance: it gives respondents two options to support the union—with direct rule or with devolved government—but only one chance to support unity. The asymmetry in the 2007 question very likely establishes a substantial response bias in favour of the union. More survey respondents will express support for the union and fewer support for unity simply because of the imbalance in response options.
I can’t understand why such an apparently biased question has been in use since 2007. I do understand, perhaps, the reason for changing the question. From 1998 to 2007, people in the north experienced long periods of direct rule intermingled with relatively short bursts of devolved government. This controversial mix of modes of governance is not at all what was envisioned in the GFA in 1998. NILT designers probably wanted to capture this mixed experience and examine its relevance to constitutional preference. But they should have captured it in a way that is fair to both sides of the constitutional divide.
In constructing a new question in 2007, survey designers might have offered two response options for unity to match the two options for union. That is, the NILT could have asked respondents if they wished that the north reunify with a unitary Irish state or reunify with devolved government in the north. [12] That a united Ireland might take a form different from the unitary southern state has considerable historical and contemporary resonance. Since the Éire Nua programme of the early 1970s, republicans have actively debated the relative merits of unitary and federal models of government for a 32-county Ireland (Reinisch, 2018). Early analysis of the GFA notes that continued devolution in the north emerges as a real option for a united Ireland (O’Leary, 1999 & 2001). Justice Humphreys argues that the GFA requires northern power-sharing institutions to remain in place after Irish unity (Humphreys, 2009 & 2018). The Working Group on Unification Referendums on the Island of Ireland considers northern devolution, a fully federal system and a unitary state as possible shapes of a united Ireland (Working Group, 2020). The SDLP calls for the northern Executive and Assembly to stay in place after reunification (SDLP, 2005). Even Sinn Féin’s overt hostility to federalism, which accompanied the break from the Ó Brádaigh to the Adams leadership, has softened as the party now contemplates devolved, federal and unitary structures as options for all-Ireland governance (Sinn Féin, 2016).
In sum, the idea that a united Ireland might take either a unitary or a federal-devolved form has been part of political discussion for some 50 years. It offered an obvious parallel to the two new response options on the union side that survey designers introduced in 2007. For reasons that escape me, the NILT ignored this debate about governmental structures in a 32-county state. It opted for an imbalanced and unfair question when a balanced and fair one was, or should have been, evident.
Table 3 gives an initial look at the impact of changing the question measuring long-term constitutional preference. In 2006, when the old question was in use, the Table records that 54 percent of all respondents choose the single option of remaining part of the UK. In 2007, with the new wording offering respondents two options to support the union, 11 percent say they wish to remain part of the UK with direct rule and 55 percent say that they wish to remain with devolved government. If we combine those two categories, a total of 66 percent of respondents support the union in 2007. Combining the two response options to arrive at one overall number is common research practice. [13] I too use the combined figure when reporting support for the union after 2006, except in Figure 6 below. Table 3 also shows that a small number of respondents choose, spontaneously and without prompting, independence or some other arrangement as their constitutional preference.
In Table 3, we can see immediately that with the new question comes increased support for the union and decreased support for unity. Support for the union rises from 54 percent in 2006 to the combined figure of 66 percent in 2007, a pro-union bounce of 12 points. Support for Irish unity falls by a smaller amount, 7 points, from 30 percent to 23 percent. Since the new question explicitly privileges union as a constitutional option, it’s no surprise that the larger impact is on support for the union. We saw this same pattern in Tables 1 and 2.
Table
3: Long-Term Constitutional Preference, 2006-2007, All Respondents
|
Response |
Percent in: |
|
||
|
2006 |
2007 |
|
||
|
Remain part of UK with direct rule Remain part of UK with devolved government Remain part of UK |
-- -- 54 |
11 55 66 |
||
|
Reunify with the rest of Ireland |
30 |
23 |
||
|
Independent state |
3 |
5 |
||
|
Other |
1 |
1 |
||
|
Don’t know |
12 |
5 |
||
|
Total Percent |
100 |
100 |
||
One more result in Table 3 is worth exploring. The column for 2007 shows that “remain with devolved government” is by far a more popular option than is “remain with direct rule.” Five times as many respondents choose devolution (55%) as choose direct rule (11%). Figure 6 indicates that, for all respondents, this strong preference for devolution over direct rule appears in every subsequent survey. The grey part of the bars in Figure 6 measures support for the union with direct rule, the black part support for the union with devolved government. In each year, the black segment of the bar is much longer than is the grey segment, indicating that the all-respondent group overwhelmingly prefers union with devolved government to union with direct rule. Although not shown in the Figure, this preference is especially strong among Catholics. [14]

Other tests of the plausibility of the question-wording hypothesis are available, which provide additional evidence to that used in our simple look at how the hypothesis performs “on the face of it.” The NILT contains different questions measuring people’s attitudes about the constitutional future of the north. Comparing these other measures to the measure of long-term constitutional preference gives valuable insights as to what may be happening. Again, I’ll focus on support for the union, as it appears to be the main effect of the change that starts in 2007.
The 2002 and 2019 surveys ask respondents: “Suppose there was a referendum tomorrow on the future of Northern Ireland and you were being asked to vote on whether Northern Ireland should unify with the Republic of Ireland. Would you vote 'yes' to unify with the Republic or 'no'?” I’ll refer to this measure as “vote in referendum tomorrow.”
Table 4 compares the percentage of people who express support for the union using the two measures of “vote in referendum tomorrow” and “long-term constitutional preference.” The Table allows us to juxtapose the results of the two measures both before and after the change in question wording on long-term constitutional preference. Recall that after the question change, “percent support for the union” is a combination of the two new response options: “percent support for the union with direct rule” and “percent support for the union with devolved government.”
Table 4 reveals that in 2002, before the change, the distributions of the two measures are remarkably similar. For all four groups, the percentage saying that they support the union as the long-term policy for the north is almost exactly equal to the percentage saying they would support the union if a referendum were held tomorrow. For Catholics, the numbers are 22 percent and 20 percent, respectively; for Protestants, they are 83 percent in both cases.
Look what happens to the two distributions in 2019, after the new question wording is in effect. The percentages begin to diverge. For each group of respondents, the percentage saying they support the union as a long-term policy is greater than the percentage saying they would support the union in a referendum tomorrow. The difference is greatest among Catholics: 35 percent as compared to 23 percent. This pattern is exactly what we would expect if there were a question-wording effect. [15] Use of a biased question for long-term constitutional preference inflates support for the union to such an extent that it yields estimates that are systematically higher than the comparable estimates of another seemingly unbiased or less biased question.
|
Group |
Percent Support for Union in 2002: |
Percent Support for Union in 2019: |
||
|
Long-term preference (old)* |
Vote in referendum tomorrow** |
Long-term preference (new)* |
Vote in referendum tomorrow** |
|
|
All respondents |
55 |
54 |
60 |
51 |
|
Catholics |
22 |
20 |
35 |
23 |
|
Protestants |
83 |
83 |
87 |
79 |
|
No religion |
53 |
52 |
51 |
47 |
Percent saying that the long-term policy for NI should be for it to remain part of the UK, using the old and new forms of the question.
An additional test of the question-wording hypothesis confirms that the altered wording for long-term constitutional preference tends to overestimate support for the union. The 2017 survey asks respondents: “If there was a referendum tomorrow about whether Northern Ireland should leave the UK and unite with the Republic of Ireland, how do you think you would vote? I would vote for Northern Ireland to remain part of the UK; I would vote for Northern Ireland to unite with the Republic of Ireland; I wouldn’t vote; I don’t know.” I’ll call this measure “vote in border poll tomorrow.” Its form is different from the “vote in referendum tomorrow” question examined in the previous table.
Table 5: Long-Term Constitutional Preference and Vote in Border. Poll Tomorrow By Religion, 2017
|
Group |
Percent Support for
Union in 2017: |
|
|
Long-term
preference (new)* |
Vote
in border poll tomorrow** |
|
|
All respondents |
61 |
55 |
|
Catholics |
40 |
25 |
|
Protestants |
84 |
85 |
|
No religion |
57 |
52 |
*Percent saying that the long-term policy for NI should be for it to remain part of the UK, using the new form of the question.
Table 5 compares the measure of long-term preference, containing the new wording, to the measure of voting in a border poll tomorrow. Once more, we see a pattern of escalated support for the union. For all groups of respondents except Protestants, the percentages in the “long-term preference” column are higher than the corresponding percentages in the “border poll tomorrow” column. And again, this effect is greatest for Catholics. Fully 40 percent of Catholics say they support the union as a long-term policy for the north; only 25 percent say they would vote to support the union in a border poll tomorrow. The higher estimates of the long-term preference measure are what we would expect if the measure’s new and biased wording artificially pushed up support for the union. [16]
ConclusionBoth explanations can account for the jump in support for the union that is evident from 2006 to 2007. But after 2007, a devolution effect seems unlikely because relatively high support for the union continues in periods of declining trust in the Assembly, weakening belief that the Assembly gives ordinary people more say in how the north is governed, and deteriorating assessments of the Assembly’s achievements. A question-wording explanation seems preferable here. It can account for the watershed shape we see in the data: high levels of support for the union persist after 2007 because the new question wording creates a response bias in favour of the union each time the question is asked.
As we saw, there are year-to-year variations in long-term constitutional preference after the change in question wording in 2007. These variations may be caused by multiple factors, including dysfunctions in devolved government. The main point is that, in each year after 2006, estimates of support for the union, no matter how much they vary each year, are probably artificially high. And estimates of support for unity are probably artificially low.
It’s likely that, other things being equal, a fairer question on long-term constitutional preference would have yielded lower estimates of support for the union and higher estimates of support for unity, especially among Catholic respondents. Evidence suggests that Catholics might have been particularly attracted to a devolved or federal form of a united Ireland, had the NILT presented them with such an option. [17]
Political analysts, researchers and the public need to approach the NILT estimates of long-term constitutional preference with extreme caution. They should especially avoid making any inferences that fail to consider the probable pro-union bias in the data. The popular acceptance of partition may not be as widespread as some people think or want.
Notes
[1] The NILT emerged from the Northern Ireland Social Attitudes Survey that ran from 1989 to 1996.
[2] All the NILT information cited in this posting, including the wording of survey questions, is publicly available on the NILT website (ARK NILT, no date). In a later project, I hope to explore in more detail the rich compilation of individual-level data that the NILT offers.
[3] Donald T. Campbell (1968 & 1969) presents the classic discussion of interrupted time-series research designs. For a comprehensive overview, see Shadish, Cook and Campbell (2002).
[4] Brexit has been linked to increased support for unity, decreased support for the union, and to both trends. See Coakley (2020), Danaher (2019) and Donaghy (2018 & 2019). The drop in support for the union that we see in the later years of Figure 1 might also be related to the continuing collapse of northern government since the resignation of Martin McGuinness as deputy first minister in January 2017. Any “devolution effect” here is entangled with the impact of Brexit.
[5] Sampling error and fluctuation will also result in variations in the number of people expressing support for union or unity. In the long run, the effects of sampling error and fluctuation are random, so it’s highly unlikely that they would produce the systematic pattern we see in the NILT data.
[6] Two suspensions were very short, lasting just 24 hours; but they represented enduring difficulties in putting power-sharing government into effect.
[7] The St Andrews Agreement was reached just as the NILT began interviewing people in 2006. That year’s survey included a question on St Andrews. It read: “how do you think you would vote in 2007 if a referendum on the St Andrew’s Agreement were held?” Analysis of this question shows, first, there is substantial support for St Andrews across all four groups of respondents. Only 2 percent of Catholics and 15 percent of Protestants, for example, report that they would vote against the St Andrews Agreement. But this result must be set against a second pattern in the data. A lot of people are unsure of what to think of the St Andrews Agreement, as indicated by the substantial proportion of survey respondents who report they wouldn’t vote in a referendum, they didn’t know how they would vote or refused to say what they might do. The number of respondents in these categories ranges from 40 to 51 percent across the four groups. This level of indecision is not surprising, given the newness of the St Andrews Agreement in 2006 and uncertainty about its implications.
If attitudes towards the St Andrews Agreement appear inconclusive, their effect on support for the union is also unclear. Recall that the question on the St Andrews Agreement was asked in 2006. If the St Andrews Agreement led to increased support for the union, we would expect to see it in the 2006 survey results. We don’t. A quick look back at Figure 1 shows a contradictory pattern of gradual increases and gradual decreases in support for the union in 2006. The strong effect we see in 2007 could, nevertheless, be a result of the restoration of devolved government, which itself was an outworking and consolidation of the St Andrews Agreement.
[8] As mentioned in note 4, the dip in support for the union in the last few years of the series that we see in Figure 1 might be related to unhappiness with the continued breakdown of devolved government since 2017. If there is any negative devolution effect on support for the union in these years, it is tied up with the impact of Brexit. Perhaps, once new NILT data become available, these possibilities could be explored in more detail.
[9] I replicated the analysis in Figures 3, 4 and 5 for Catholics, Protestants and those with no religion. The conclusions I cite for all respondents generally hold for the three religious groups too.
[10] Other authors have noted that face-to-face surveys and online surveys can yield very dissimilar estimates of constitutional preference, partly because of differences in the mode of interviewing and the sampling design (Working Group, 2020; Donaghy, 2018 & 2020; & Meagher, 2020). My analysis “controls for” these effects. I examine just the NILT surveys, which always use face-to-face interviewing and some form of random sampling. This approach allows me to rule out interviewing mode and sampling design as alternative explanations for the observed changes in constitutional preference, and to focus instead on question-wording as a probable explanation.
[11] Coakley often works with NILT data (and other public opinion surveys). Sometimes he mentions the change in question wording in a note (2017); sometimes he mentions it in a note and in the body of his paper, however briefly or parenthetically (2015, 2018, & 2020). Sometimes he seems to understand its impact, other times he does not (2020). On this last point, see note 15.
[12] Or the survey could have asked some similar question that gives respondents two options to express support for Irish unity. Another completely different and perhaps better possibility is to leave the 2006 form of the question as it is. In changing the question in 2007, NILT designers seem confused about what they’re trying to measure. They’ve confounded measuring assessments of devolution and direct rule on the one hand with measuring constitutional preference on the other. These are two separate (but related) issues that might best be measured separately. If properly measured, analysts can then explore the nature of the relationship between the two.
[13] Coakley both combines the two response options (2015 & 2017) and keeps them separate (2020). The NILT combines the two options in its time series data.
[14] To take the year 2010 as an example, more than 7 times as many Catholics prefer union with devolution as prefer union with direct rule. The corresponding ratios for Protestants and the no religion group are just over 3. This pattern is typical, except for 2018 and 2019, when the ratios for the no religion group slightly exceed those for Catholics. In 2019, the Protestant ratio is highest, reflecting the drop in support for the union with devolution among Catholics and the no religion group. In 2019, the lingering Brexit crisis and the continuing collapse of power-sharing government may have dampened these groups’ enthusiasm for union generally and for devolved government particularly. Coakley (2018) also notes a strong Catholic preference for union with devolved government over union with direct rule.
[15] In any event, we might expect these two measures to yield different estimates, most obviously because they take different perspectives: one asking respondents how they would vote tomorrow, the other asking them their long-term constitutional preference. That the two measures differ exactly as the question-wording hypothesis predicts does, nevertheless, provide evidence in support of the hypothesis. Coakley (2020) constructs expectations about support for unity rather than support for the union. His expectations are very different from mine. He expects that the percentage of respondents saying they support unity on a “referendum tomorrow” measure would be lower than the corresponding percentage on a “long-term preference” measure. I expect exactly the opposite: that the “referendum tomorrow” percentage would be higher because the “long-term preference” measure probably underestimates support for unity, an expectation that is confirmed by the NILT data Coakley cites. Coakley is aware that the change in question wording on the “long-term preference” measure disadvantages a pro-unity response. But he forgets to take this bias into account when constructing his relative expectations about the “referendum tomorrow” and “long-term preference” questions. See the next note.
[16] I reanalyzed Tables 4 and 5 looking at support for Irish unity. The expected pattern is not so clear here. This lack of clarity might emerge because support for unity is very much a secondary effect of the 2007 interruption.
[17] Recall that Catholics were particularly sensitive to the 2007 interruption and especially attracted to the devolution option for remaining in the union.
References
ARK NILT. (no date). “Northern Ireland Life and Times Survey.” Retrieved from https://www.ark.ac.uk/nilt/Campbell, D.T. (1968). “The Connecticut Crackdown on Speeding: Time-Series Data in Quasi-Experimental Analysis.” Law & Society Review 3:1 (August): 33-54.
Campbell, D.T. (1969). “Reforms as Experiments.” American Psychologist 24:4 (April): 409-429.
Coakley, J. (2015). “Does Ulster still say ‘no’? Public opinion and the future of Northern Ireland.” In The Act of Voting: Identities, Institutions and Locale. ed. J.A. Elkink and D.M. Farrell, 35-55. London: Routledge.
Coakley, J. (2017). “Resolving international border disputes: The Irish experience.” Cooperation and Conflict 52:3 (September): 377-398.
Coakley, J. (2018). “Catholics in Northern Ireland: Changing Political Attitudes, 1968-2018.” In The Contested Identities of Ulster Catholics. ed. T.P. Burgess, 21-37. Cham, Switzerland: Palgrave Macmillan.
Coakley, J. (2020). “Public Opinion and Irish Unity: Some Comparative Data.” PublicPolicy.IE. 9 December. Retrieved from https://publicpolicy.ie/perspectives/public-opinion-and-irish-unity-some-comparative-data/
Danaher, S. (2019). “Some analysis on the recent Northern Ireland Lord Ashcroft poll.” 18 September. Progressive Pulse. Retrieved from http://www.progressivepulse.org/brexit/some-analysis-on-the-recent-northern-ireland-lord-ashcroft-poll
Donaghy, P. (2018). “How has opinion in Northern Ireland on the border question changed since the Brexit referendum?” Slugger O’Toole. 24 June. Retrieved from https://sluggerotoole.com/2018/06/24/how-has-opinion-in-northern-ireland-on-the-border-question-changed-since-the-brexit-referendum/
Donaghy, P. (2019). “A ‘likely’ story—the Secretary of State needs to explain under what circumstances he would hold a border poll.” Slugger O’Toole. 11 September. Retrieved from https://sluggerotoole.com/2019/09/11/a-likely-story-the-secretary-of-state-needs-to-explain-under-what-circumstances-he-would-hold-a-border-poll/
Donaghy, P. (2020). “The mystery of the ‘shy nationalists’—online and face-to-face polling on Irish unity continues to give different results.” Slugger O’Toole. 19 February. Retrieved from https://sluggerotoole.com/2020/02/19/the-mystery-of-the-shy-nationalists-online-and-face-to-face-polling-on-irish-unity-continues-to-give-different-results/
Graham, W. (2007a). “Power-sharing - Devolution returns to Stormont - Unlikely convergence of foes' political paths.” Irish News. 8 May. Retrieved from the Factiva (Dow Jones) electronic database of news articles.
Graham, W. (2007b). “Political resolution can be 'an example to the world.'” Irish News. 10 May. Retrieved from Factiva.
Humphreys, R. (2009). Countdown to Unity: Debating Irish Reunification. Dublin and Portland: Irish Academic Press.
Humphreys, R. (2018). Beyond the Border: The Good Friday Agreement and Irish Unity after Brexit. Newbridge, Co. Kildare: Merrion Press.
Meagher, K. (2020). “Is support for Irish unity at 29% - or 45%?” eamonnmallie.com. 25 February. Retrieved from https://eamonnmallie.com/2020/02/is-support-for-irish-unity-at-29-or-45-by-kevin-meagher/
O’Leary, B. (1999). “The Nature of the British-Irish Agreement.” New Left Review no. 233 (January/February): 66-96.
O’Leary, B. (2001). “The Character of the 1998 Agreement: Results and Prospects.” In Aspects of the Belfast Agreement. ed. R. Wilford, 49-83. Oxford: Oxford University Press.
Reinisch, D. (2018). “State Papers, Sinn Féin & Federalism.” European University Institute. 30 December. Retrieved from https://me.eui.eu/dieter-reinisch/blog/state-papers-federalism/
SDLP. (2005). A United Ireland and The Agreement. Social Democratic & Labour Party. 21 March. Retrieved from https://cain.ulster.ac.uk/issues/politics/docs/sdlp/sdlp210305unity.pdf
Shadish, W.R., T.D. Cook and D.T. Campbell. (2002). Experimental and Quasi-Experimental Designs for Generalized Causal Inference. Boston and New York: Houghton Mifflin Company.
Sinn Féin. (2016). Towards a United Ireland: A Sinn Féin Discussion Document. 28 November. Retrieved from https://www.sinnfein.ie/files/2016/Towards-a-United-Ireland.pdf
Working Group. (2020). Interim Report. Working Group on Unification Referendums on the Island of Ireland. The Constitution Unit, University College London. November. Retrieved from https://www.ucl.ac.uk/constitution-unit/research/elections-and-referendums/working-group-unification-referendums-island-ireland


 has, since 2007, systematically and significantly over...&p[url]=https://www.thepensivequill.com/2021/05/up-with-union-down-with-unity-measuring.html&p[images][0]=https://blogger.googleusercontent.com/img/b/R29vZ2xl/AVvXsEgySOGJZkcW20mA7GOvW9cescDhc8WfIzHRS4PHS3O-98Lm4VIJrvWolnv06gN3MnfOerK9UzC8bzf2xaVs43HyUbxW7sRjelAfoO1JGgFrKj8pPZ1r4XB38tI_9ys7xi3JuAbhTjrETyA/s0/01+Quill+Hand.png)
Mike - as always, a well researched and presented piece which TPQ is pleased to feature. There is a lot here for people to think over. It reminds us of just how complicated the process is likely to be. Complications are an unavoidable aspect of life. What is really bothersome is when people start add convolutions to the complications for the purpose of obfuscating. I think we will see that in any run in to a border poll.
ReplyDeleteA brilliant, reasoned, but not balanced exploration of future Irish unity referendums
ReplyDeleteMike, a piece by Andy Pollak that you might find worth a read.
Anthony,
ReplyDeleteThanks for the kind words and bringing the Pollak piece to my attention. Pollak makes some of the same points in his recent article in Fortnight (no. 481, April 2021).
I’m currently going through the Final Report of the Working Group on Unification Referendums on the Island of Ireland, which Pollak examines in his blog. At first glance, the Final Report appears not to be substantively different from the Interim Report and therefore suffers from the same problems I mentioned in my post on “Academics Discussing Border Polls.” I think Pollak misses the real significance of the reports.
I agree with your comment about how deliberate obfuscation will likely tarnish the run up to any border poll. It may be impossible to have a reasoned and informed debate about a united Ireland. People’s basic right to self-determination may get lost in a sea of irresponsible claims and irrelevant provocations.
Current attempts to bully people into abandoning their advocacy of a united Ireland, which is the larger political objective of protests against the protocol, won’t help matters. Unfortunately, too many players—including Pollak, Seamus Mallon, some southern politicians, a whole host of news commentators, and many unionist leaders—seem determined to reactivate the politics of fear.
Mike - I had a brief exchange with Andy and recommended your post to him. At the heel of the hunt, what mane seem intent on doing is to acquiesce in the strategy of threat. To abandon 50+1 is to tell Northern nationalists that their vote is worth less than that of unionists; that nationalists have to work harder to get unity than unionists have to work to maintain partition.
DeleteAnthony,
ReplyDeleteVery well put. This kind of privileging of unionism over nationalism is precisely what Pollak and his ilk routinely ignore.
In my draft response to your comment, I had a longer critique of Pollak's work. Perhaps I'll save that for another day. It looks like there'll be plenty of opportunities to intervene in the debate.
CRN pigs are equal to PUL ones!
ReplyDeleteSam McBride: Few have yet realised the staggering complexity behind a border poll
ReplyDelete